Arcade Machine for Bar ROI: How Fast Is the Payback, Really?
Read about ROI forecasts for arcade machines set in a bar, with real revenue benchmarks, three payback scenarios, running costs, and a model you can adapt to your venue.
Highlights
- Published arcade benchmarks were measured on game rooms, not bars — route-stop revenue runs $50–$150 per machine per week
- A $4,250 machine at the $150 base case pays back in about 28 weeks; at the published $50 floor it takes about 85
- $150 a week at $1 per play means one paid play every 34 minutes across a twelve-hour day — test the play count, not the dollar figure
- Payback is not profit: electricity, a maintenance reserve and a licence allowance model out at about $55 a month
If you have looked into putting an arcade machine in a bar, you've probably met the same two answers.
One is a confident weekly dollar figure from a company that sells machines, with no working shown. The other is a shrug and a story about a place down the road that does well with one.
Neither helps when you are deciding whether to commit four thousand dollars of your own money to a corner of your floor.
This article takes a different approach:
- starts with published arcade-industry benchmarks;
- explains who those numbers were measured on;
- separates arcade revenue from bar and route-stop revenue;
- builds pessimistic, base and optimistic payback scenarios;
- shows every assumption behind the calculation;
- includes running costs rather than stopping at gross revenue.
You can swap our assumptions for yours and the model still works.
(!) A note on the benchmarks: bar-specific revenue data is limited, so the scenarios below use broader arcade and route-stop industry figures as reference points.
Rather than treating any one weekly revenue number as universal, we use those benchmarks to build a range of outcomes and make the assumptions behind each scenario explicit.
What the Published Numbers Say – and Who They Were Measured On
Start with what is actually published. Several industry sources give weekly revenue per arcade machine, and their ranges overlap enough to be useful once you read the fine print.
| Publisher | Per machine, per week | What it measured | Source |
|---|---|---|---|
| Party Center Software | $200–$485 | Arcades and family entertainment centres, annualised | Source |
| Dojo Business | ~$250 average; $50–$100 in poor spots | Arcade game rooms | Source |
| Report Desk | $50–$150 route stops; $200–$500+ destination venues | Split by placement type | Source |
The right-hand columns matter more than the headline dollar figures.
Party Center Software's $200 to $485 describes game rooms, where the machines are one of the reasons people walked through the door.
Dojo Business quotes roughly $250 across the same kind of venue, while noting that a machine in a weaker location may take only $50 to $100 a week.
Report Desk is especially useful here because it separates the range by placement type, not just machine type.
Destination venue vs. route stop
A destination venue is somewhere people travel specifically to play. A route stop is a bar, restaurant, laundromat or similar location where the machine sits alongside the main reason people came.
That distinction matters:
- same cabinet;
- same games;
- same price per play;
- very different customer intent.
So when a supplier quotes $300 a week, the figure may be real. It may simply describe a very different venue.
For a bar, destination-arcade revenue is better treated as an aggressive benchmark, not as the expected result.
The published route-stop range is the more useful starting point.
Why a Bar or Event Venue Is a Different Environment
Your guests did not primarily come to play.
They came to drink, eat, watch something on the screen, and spend time with other people. Arcade play happens around those activities.
Typical play windows might include:
- waiting for a table;
- waiting for another round;
- filling a few minutes before friends arrive;
- staying around after the meal;
- competing casually with someone else at the bar.
That is a real market, but it behaves differently from an arcade. An event venue behaves differently again.
Traffic may be concentrated into only a handful of hours. A machine can therefore generate substantial play during one busy evening but sit unused between bookings.
| Arcade / FEC | Bar | Event venue | |
|---|---|---|---|
| Why guests came | To play | To drink and socialise | For the event |
| Play window | The whole visit | Gaps between rounds and activities | A few concentrated hours |
| Competing spend | Other machines | Drinks and food | Bar, food, the event itself |
| Trading pattern | Steady, long hours | Steady, often weekend-heavy | Bursts, with dark weeks |
The practical takeaway is simple:
Do not apply arcade averages directly to a bar.
Use route-stop data as your starting point and adjust it for your own traffic, placement and customer behaviour.
Three Payback Scenarios, With the Assumptions Shown
Here is the model. Every major input is listed – so you can replace our numbers with yours.
Assumptions
-
Purchase price: $4,250
Paid outright, with no financing. This is a real list price for a new commercial bartop machine; we identify the machine later in the article.
-
No operator revenue split
You own the machine and keep the machine revenue.
-
Price per play: $1.00
This is the top of a $0.50 to $1.00 range reported by operators in industry forums rather than measured by a formal survey.
-
52 trading weeks
No seasonal shutdown is included.
-
Base-case revenue: $150 per week
This uses the top of the published $50–$150 route-stop range rather than assuming arcade-level revenue.
We then model a weaker and stronger result around that benchmark.
| Scenario | Per week | Per month (×4.33) | Payback before running costs |
|---|---|---|---|
| Pessimistic | $75 | ~$325 | ~57 weeks / 13.1 months |
| Base case | $150 | ~$650 | ~28 weeks / 6.5 months |
| Optimistic | $225 | ~$974 | ~19 weeks / 4.4 months |
Does the base case feel realistic in your room?
At $1 per play, $150 a week means:
- 150 plays per week;
- roughly 21 plays per day if open seven days;
- approximately one paid play every 34 minutes across a twelve-hour day.
That is a more useful test than the revenue figure itself.
Can you realistically picture that level of play at the location where the machine would sit? If not, lower the assumption.
And the downside can be materially lower. At the published route-stop floor of $50 per week, a $4,250 machine would need about 85 weeks to return its purchase price before running costs.
What It Earns After It Has Paid for Itself
Payback is only part of the calculation.
Once the purchase price has been paid back, the machine can continue generating revenue – but gross revenue is not the same as profit.
External benchmark vs. planning allowances
Some costs are easier to estimate than others.
| Running cost | Modelled monthly | Basis |
|---|---|---|
| Electricity | $10 | Published single-cabinet estimates of roughly $5–$15/month at moderate hours |
| Maintenance reserve | $30 | Based on JVL's service data, using the upper end of the observed monthly range |
| Permit / licence allowance | $15 | Planning allowance where a local licence applies |
| Insurance | Not priced | No usable single-machine figure found |
| Total modelled | $55 | Excludes insurance |
Electricity is the most straightforward item.
Maintenance is harder to generalise. Dojo Business puts per-machine running costs at $70 to $220 a month. However, based on our own service data, maintenance for a single machine typically does not exceed $20 per month, reaching around $30 only in less common cases.
For this model, we therefore use the upper end of that range: a $30 monthly maintenance reserve, or about $360 a year. That is a budgeting assumption rather than a prediction of actual repairs.
Insurance is not included. We didn't find a usable published figure for what one arcade machine adds to an existing venue policy.
Ask your broker before relying on the totals below.
| Scenario | Monthly revenue | Modelled running costs | Net monthly | Payback including modelled costs |
|---|---|---|---|---|
| Pessimistic | ~$325 | $55 | ~$270 | ~15.7 months |
| Base case | ~$650 | $55 | ~$595 | ~7.1 months |
| Optimistic | ~$974 | $55 | ~$919 | ~4.6 months |
Costs this model still leaves out
This calculation does not include:
- floor or counter space;
- staff time spent servicing the machine;
- cash handling;
- insurance;
- depreciation;
- financing costs;
- unexpected major repairs.
Published lifespan estimates also vary depending on machine type and operating conditions.
The useful question is therefore not:
“Will this exact machine pay back in exactly 7.1 months?”
It is:
“Do the economics still make sense if my real result is materially worse than the base case?”
That is the safer way to use any ROI model.
What This Model Does Not Count: Goodwill, Repeat Visits and Referrals
There is a second kind of return here, and the honest position is that we cannot put a reliable number on it.
An arcade machine could potentially affect:
- how long a group stays;
- whether guests order another round;
- how enjoyable a wait for a table feels;
- whether regulars create a recurring competition;
- whether people bring friends back to play.
Our research did not find a published attempt to put a reliable dollar value on the goodwill or repeat visits created by one arcade machine in a bar.
So those effects are not included in the ROI model.
The extra round, the returning Friday group, the referral: all plausibly valuable, none reliably priced here.
Treat them as potential upside rather than as revenue you need in order to justify the purchase. If machine revenue alone makes the economics work, any broader customer effect is an additional benefit. If machine revenue alone does not make the economics work, do not justify the investment using an effect nobody has quantified. The same caution works in the other direction.
Poor placement can also hurt the guest experience:
- noise beside tables where people want to talk;
- a queue blocking a service path;
- a screen competing with the atmosphere of the room;
- players standing where staff need to move.
The indirect effects are not automatically positive. They depend heavily on placement.
Protecting Your Payback Timeline: Placement, Game Mix, and Buy vs. Rent
Three factors can materially change the model:
- where the machine sits;
- what people can play;
- whether ownership makes sense for your venue at all.
1. Placement
The published data already shows how strongly location can affect machine revenue. In a bar, potentially stronger positions are places where guests already spend time or naturally pass:
- the end of the counter;
- beside a waiting area;
- close to a social standing area;
- along a high-traffic path that does not interfere with service.
The weak position is often simply the empty corner where the machine happens to fit.
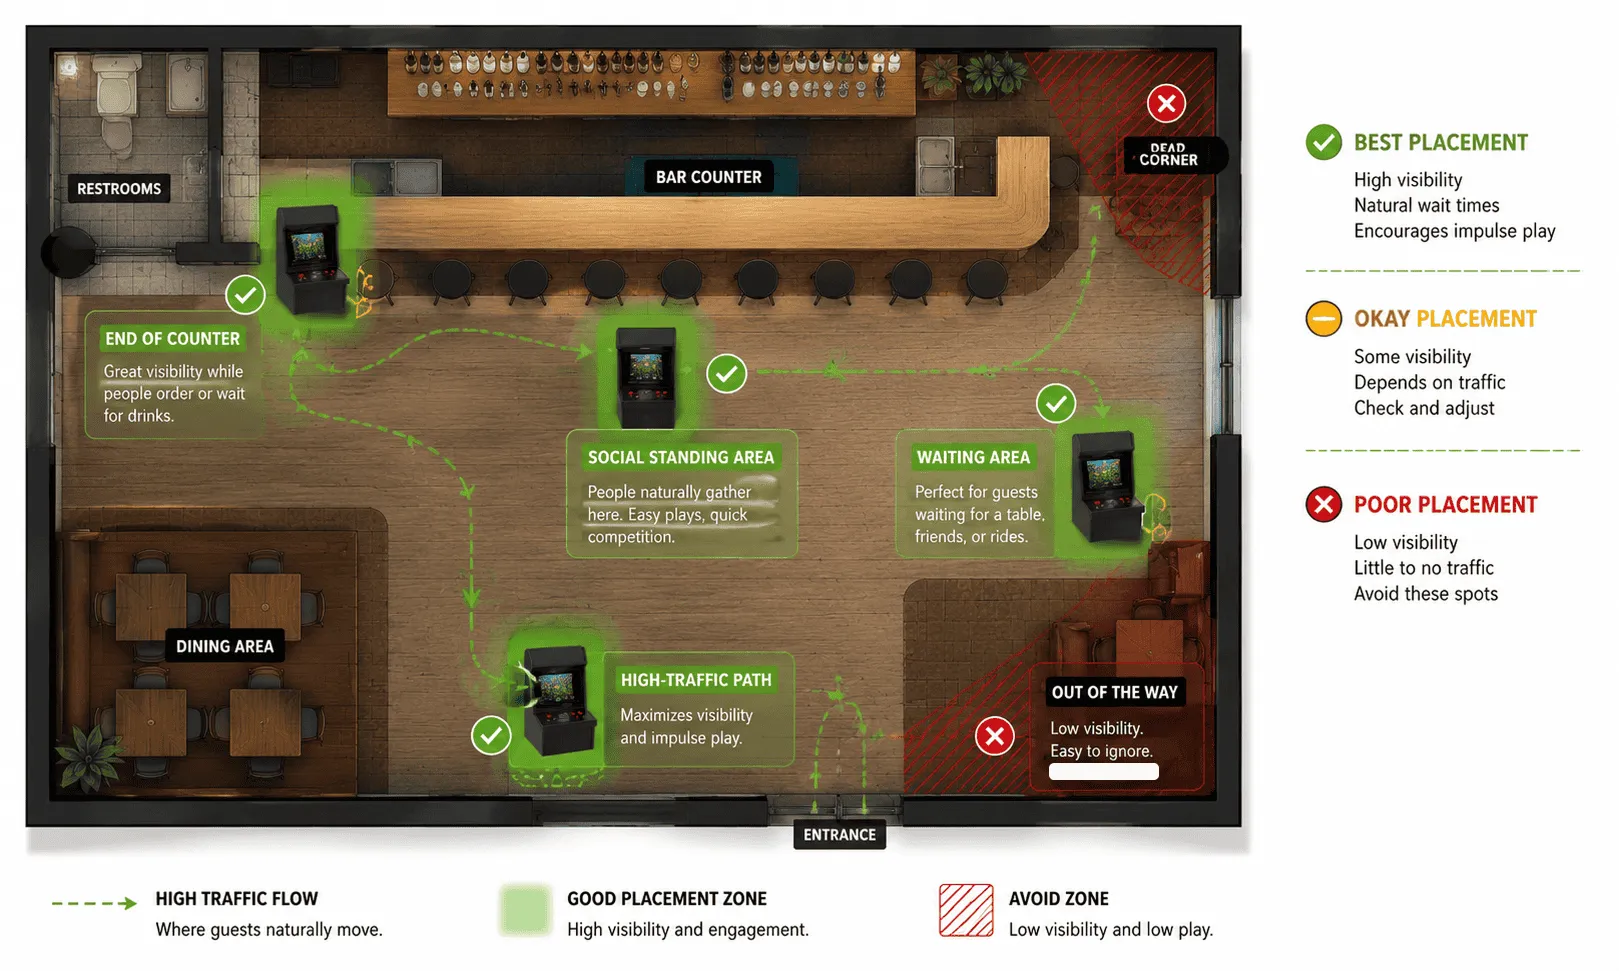
Good visibility does not guarantee revenue, but poor visibility can make even a good machine difficult to discover.
2. Game mix
A bar also has different game requirements from a traditional arcade. Guests may have only a few minutes and may be playing while holding a drink.
That favours games that are:
- quick to understand;
- easy to start;
- playable in short sessions;
- social or competitive;
- familiar enough to require little explanation.
Depending on the audience, that may include:
- cards;
- puzzles;
- trivia;
- word games;
- short competitive games;
- bar-sports-style games.
A game that requires ten minutes of explanation creates much more friction in this environment.
3. Buy vs. rent
Event rental vendors advertise roughly $350 to $500 per machine per day, often with delivery and pickup charged separately.
These are vendor asking prices, not verified market averages, so treat them as a reference rather than a universal rate.
| Buy outright | Rent per event | |
|---|---|---|
| Cost | $4,250 once | ~$350–$500 per machine per day, plus delivery |
| Base-case breakeven | ~28 weeks before running costs | No ownership breakeven; each event creates another rental cost |
| Best suited to | Permanent placement and regular trade | Occasional events |
| Main risk | Poor utilisation slows payback | Repeated rental costs accumulate |
At those advertised rental rates, roughly 9 to 13 rental days add up to the $4,250 purchase price before delivery costs. That does not automatically mean buying is better: ownership also carries utilisation risk, maintenance and capital cost.
But it gives event operators a useful threshold.
- If you need a machine only once or twice a year, renting may make more sense.
- If you expect frequent use across the year, ownership becomes much easier to justify.
Where the JVL ECHO HD3 Commercial Edition Fits Into This Math
The $4,250 purchase price used throughout this model is the list price of the JVL ECHO HD3 Commercial Edition.
We kept the product out of the calculation until this point deliberately: the ROI framework should still make sense whichever commercial arcade machine you are evaluating.
ECHO features that directly affect the model
- $4,250 USD list price for the Commercial Edition.
- Bill acceptor for $1, $5, $10 and $20 notes, with a 500-note capacity.
- Coin acceptor for quarters.
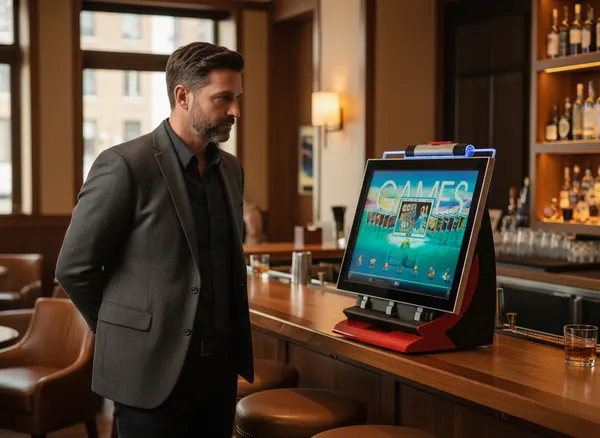
- 22-inch HD touchscreen.
- 149 pre-installed JVL games.
- No downloads, accounts or Wi-Fi required.
- One-year all-inclusive manufacturer warranty.
The Commercial Edition differs from the Home Edition in an important way: the Home model is designed for free play and does not include the bill or coin acceptors.
Touch controls also remove one common category of mechanical wear associated with physical joystick and button assemblies. That does not mean the machine is maintenance-free. Screens, electronics and other components can still require service. Running fully offline can also reduce another source of interruption: the machine does not depend on an internet connection or downloaded content in order to operate.
Each ECHO unit is powered on and tested before shipment, and JVL's bartop history goes back more than 30 years. For a commercial installation, the relevant next step is the dedicated ECHO HD3 Commercial Edition page rather than the Home Edition page. There you can evaluate the machine itself against the traffic and revenue assumptions used above.
Frequently asked questions
Does adding a second arcade machine double the revenue from the same venue?
Not necessarily. A second machine increases capacity, but revenue still depends on how many guests actually want to play. If the first machine rarely has a queue, the second may simply split the same demand.
Does a cashless payment option earn more than a coin box in a bar setting?
Cashless payment can reduce friction because guests do not need the right coins or bills. But we found no reliable bar-specific data showing a guaranteed revenue increase.
How much does foot traffic need to rise before it noticeably shortens an arcade machine's payback?
More nearby traffic creates more opportunities for play, but traffic and revenue do not increase one-for-one. The effect depends on how many people notice the machine and actually pay to play.
If foot traffic drops for a few months, does that reset the payback clock?
No. A slow period only delays payback. Revenue already earned still counts toward recovering the original purchase price.
Does staff time spent servicing an arcade machine cut meaningfully into profit?
Usually only modestly, but it should still be included in your model. Staff may need to empty cash, check the machine and handle occasional customer or service issues.
What warranty coverage comes with a commercial-grade bartop arcade machine like the ECHO HD3?
JVL provides a one-year, all-inclusive manufacturer warranty for the ECHO HD3. For commercial use, you can confirm current service, parts and shipping terms directly with JVL before buying.
Sources
7 sources